🎨 Annotationen#
🏷️ Legenden mit plt.legend()#
🔹 Automatisch:#
plt.plot(x, y, label="sin(x)")
plt.legend()
➡️ Funktioniert, wenn label=… im Plot gesetzt wurde.
🔹 Manuell:#
plt.legend(loc="upper right", title="Funktion")
📌 Mögliche loc-Werte: "best", "upper left", "lower right", etc.
✏️ Annotation mit plt.annotate()#
plt.plot(x, y)
plt.annotate("Maximalwert", xy=(x_max, y_max), xytext=(x_max, y_max+0.5),
             arrowprops=dict(arrowstyle="->", color="red"))
Argument |
Bedeutung |
|---|---|
|
Punkt im Plot (x, y), wo Pfeil endet |
|
Position des Texts |
|
Pfeilgestaltung |
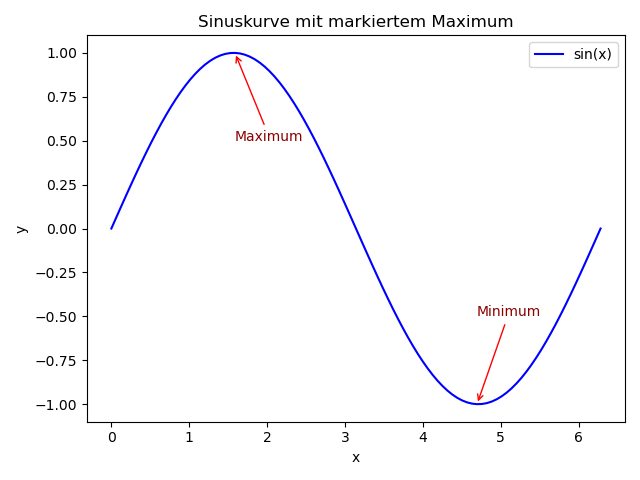
🧪 Beispiel#
import numpy as np
import matplotlib.pyplot as plt

x = np.linspace(0, 6.283, 100)
y = np.sin(x)

# Extremwert ermitteln
x_max = x[np.argmax(y)]
y_max = np.max(y)

x_min = x[np.argmin(y)]
y_min = np.min(y)

# Plot
plt.plot(x, y, label="sin(x)", color="blue")
plt.title("Sinuskurve mit markiertem Maximum")
plt.xlabel("x")
plt.ylabel("y")
plt.legend()

# Annotation
plt.annotate("Maximum",
             xy=(x_max, y_max),
             xytext=(x_max + 0.0, y_max - 0.5),
             arrowprops=dict(arrowstyle="->", color="red"),
             fontsize=10, color="darkred")

plt.annotate("Minimum",
             xy=(x_min, y_min),
             xytext=(x_min + 0.0, y_min + 0.5),
             arrowprops=dict(arrowstyle="->", color="red"),
             fontsize=10, color="darkred")

plt.tight_layout()
plt.savefig("extremwert.png", dpi=300)
plt.show()